library(tidyverse)
library(tidytuesdayR)
library(DT)
library(ggimage)
library(hrbrthemes)
library(ggtext)Dataset Info
The data this week comes from ravelry.com by way of Alice Walsh.
Ravelry describes itself as a social networking and organizational tool for knitters, crocheters, designers, spinners, weavers and dyers.
Required Library
Importing Data
tt <- tt_load("2022-10-11")
yarn_df <- tt$yarn
Lets look into the dataset
yarn_df %>%
  head(20) %>%
  datatable(options = list(pageLength = 5))
Data Wrangling:
Selecting top reviewed companies on Ravelry
yarn_df %>%
  count(yarn_company_name) %>%
  top_n(10,n) %>%
knitr::kable()| yarn_company_name | n |
|---|---|
| Bernat | 461 |
| ColourMart | 732 |
| Ice Yarns | 811 |
| Katia | 761 |
| Lana Grossa | 1163 |
| Lang Yarns | 555 |
| Lion Brand | 390 |
| ONline | 541 |
| Phildar | 533 |
| Plymouth Yarn | 391 |
Selecting only products of Lana Grossa, ColourMart, Lang Yarns & Phildar
top <- c("Lana Grossa", "ColourMart", "Lang Yarns", "Phildar")

df <-
yarn_df %>%
  select(yarn_company_name, rating_average) %>%
  filter(yarn_company_name %in% top)
Data Visualization
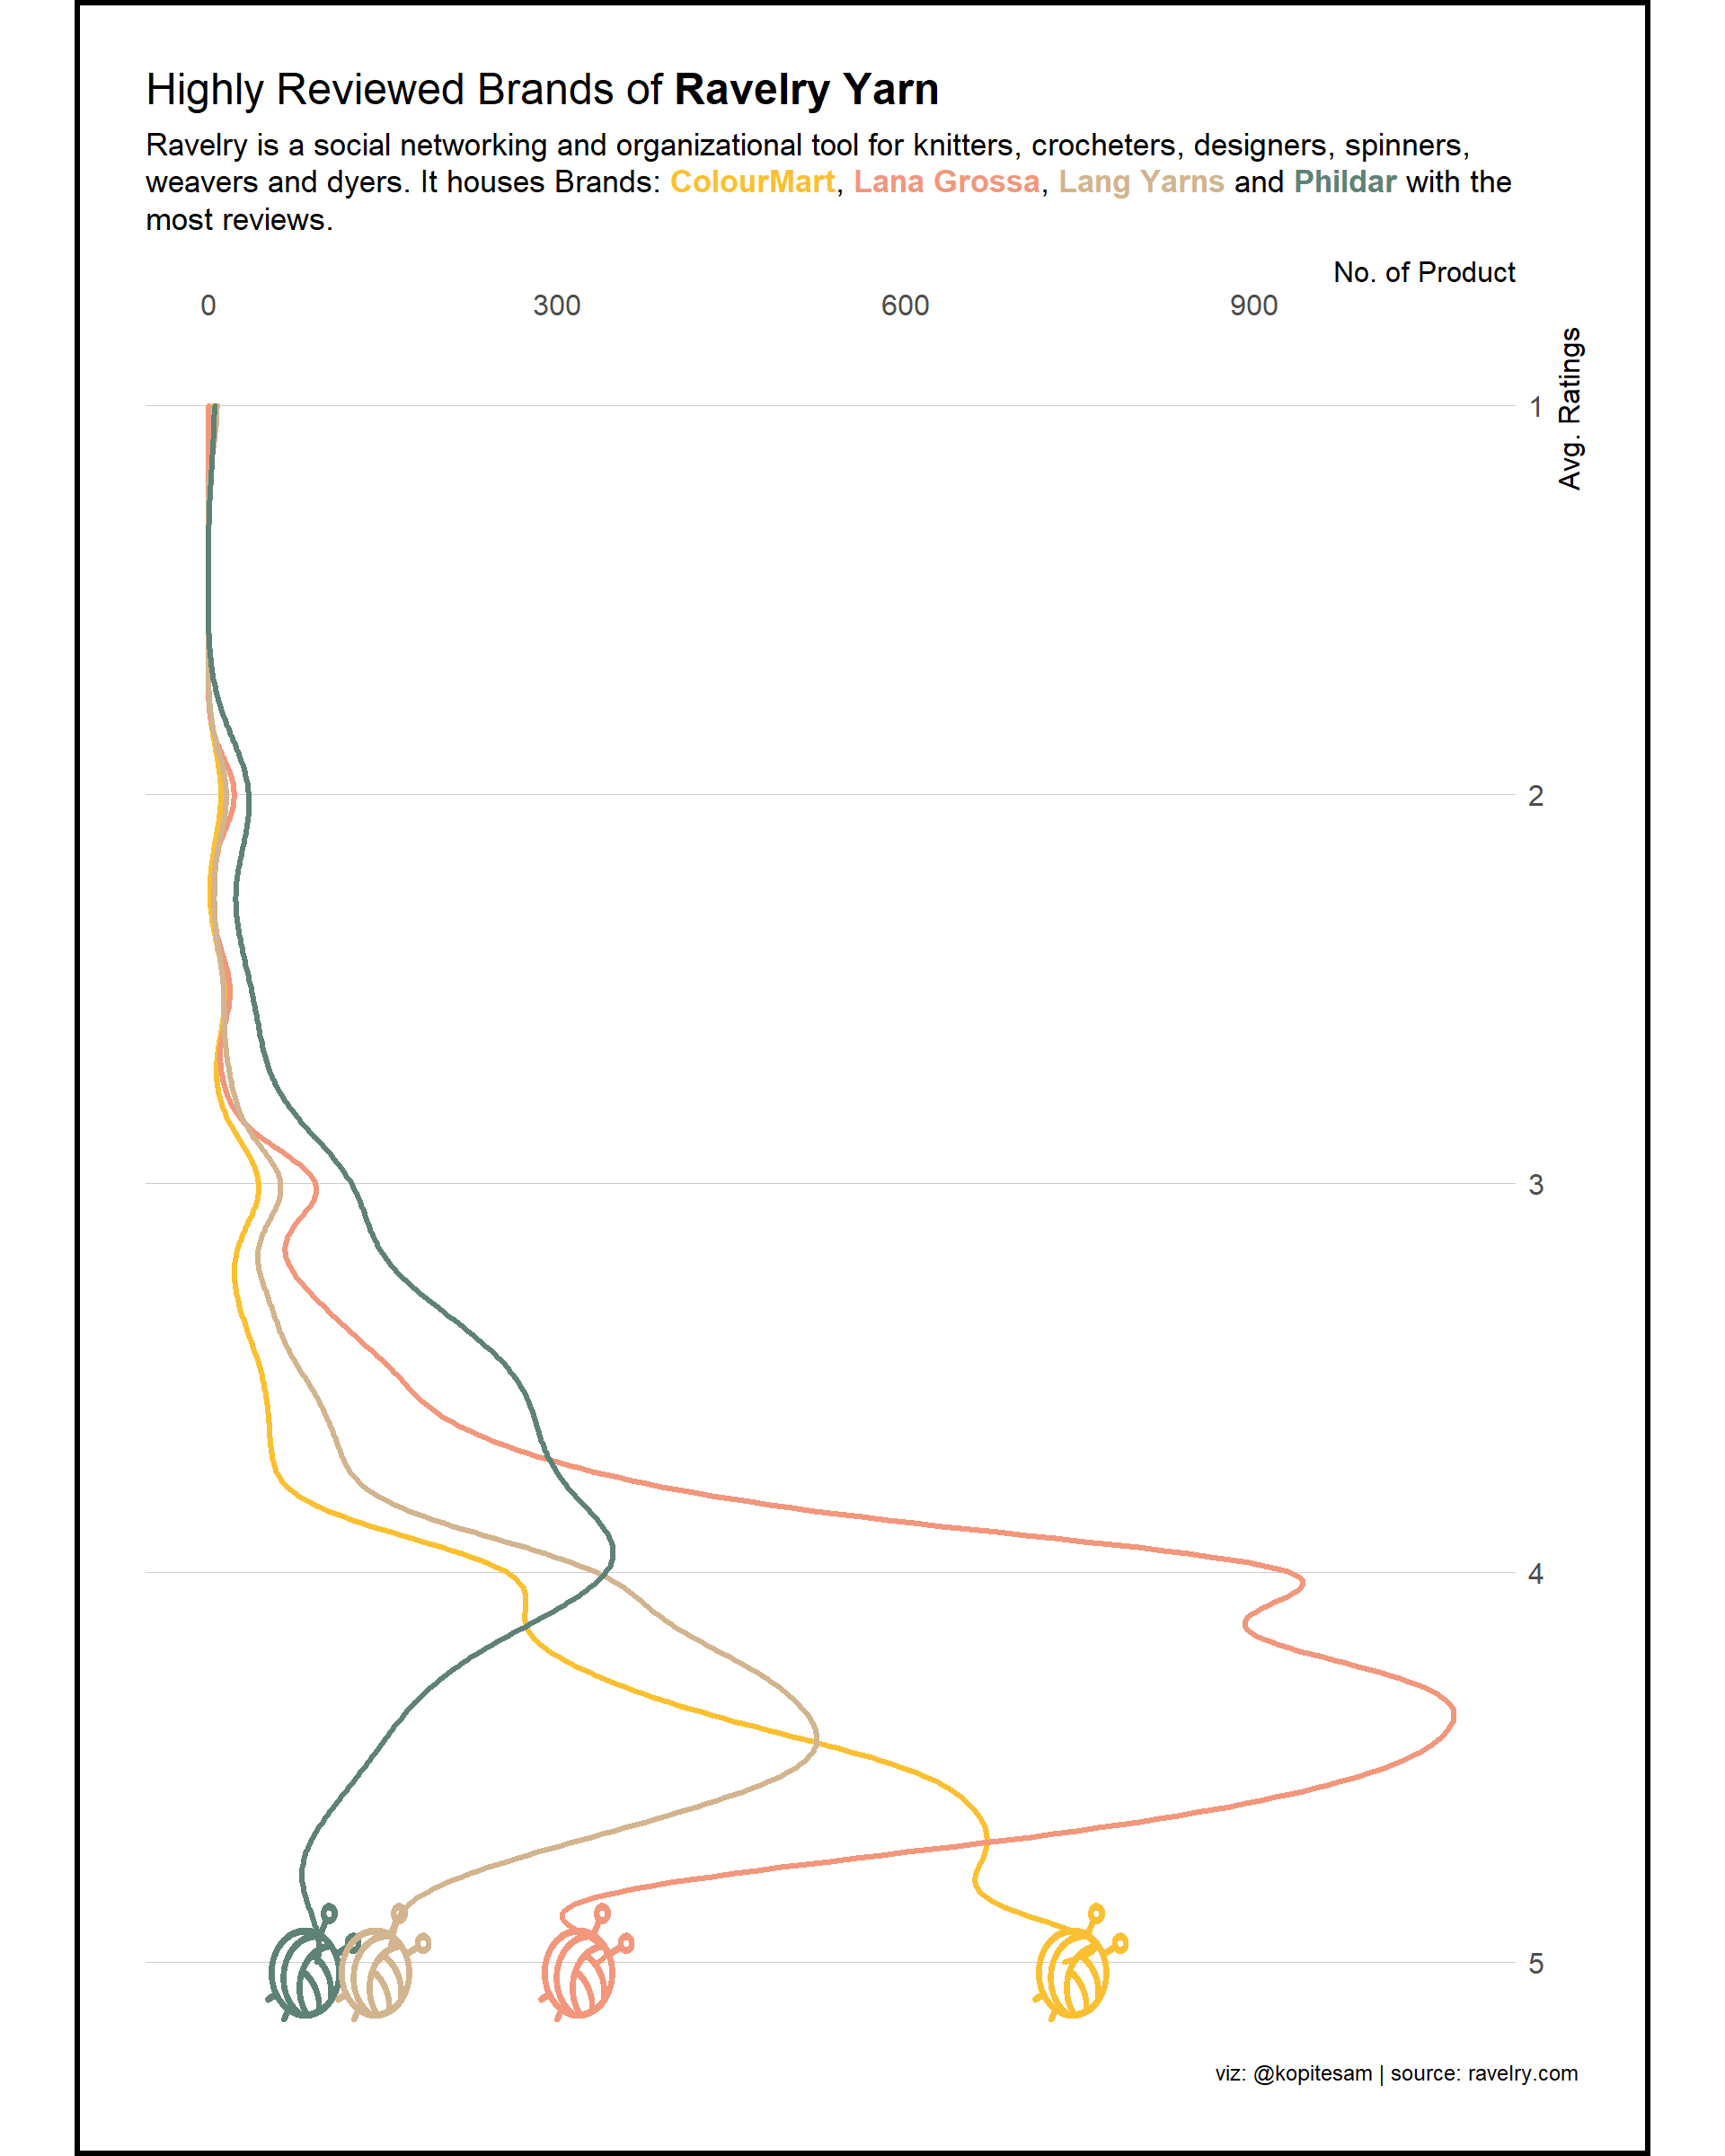
Going through the data, it seems straightforward to visualize. For this dataset, I will go with density plot of average review of a product. As for aesthetic, using the threads of yarn to represent the curve lines should look great. As I want the yarns to give the impression of falling down, I will need to place axis on different side.
Color Palette and Graphics
# Selecting 4 color scheme
color_scheme = c('#FBC031', '#F2967C', '#D2B48E', '#5E8276')

# Yarn icon in the color scheme
yarn_yellow_img <- paste0(here::here(), "/posts/Ravelry Yarn/yarn-yellow.png")
yarn_green_img <- paste0(here::here(), "/posts/Ravelry Yarn/yarn-green.png")
yarn_gray_img <- paste0(here::here(), "/posts/Ravelry Yarn/yarn-gray.png")
yarn_pink_img <- paste0(here::here(), "/posts/Ravelry Yarn/yarn-pink.png")
Density Plot
df %>%
  ggplot() +
  geom_density(aes(y=rating_average, x=after_stat(count), color=yarn_company_name), size = 1.2)+
  geom_image(aes(x=750, y=5,image = yarn_yellow_img), size = 0.07)+
  geom_image(aes(x=90, y=5,image = yarn_green_img), size = 0.07)+
  geom_image(aes(x=150, y=5,image = yarn_gray_img), size = 0.07)+
  geom_image(aes(x=325, y=5,image = yarn_pink_img), size = 0.07)+
  labs(y='Avg. Ratings',
       x='No. of Product',
       guides = FALSE,
       color='',
       title= 'Highly Reviewed Brands of **Ravelry Yarn**',
       subtitle = "<br>Ravelry is a social networking and organizational tool for knitters, crocheters, designers, spinners, weavers and dyers. It houses Brands:
                  <span style = 'color:#FBC031;'>**ColourMart**</span>,
                  <span style = 'color:#F2967C;'>**Lana Grossa**</span>,
                  <span style = 'color:#D2B48E;'>**Lang Yarns**</span> and
                  <span style = 'color:#5E8276;'>**Phildar**</span> with the most reviews.<br>",
       caption = "viz: @kopitesam | source: ravelry.com") +
  scale_x_continuous(position = "top") +
  scale_y_reverse(position = "right")+
  scale_colour_manual(values = color_scheme)+
  theme_ipsum_ps(grid="Y",
                 axis_text_size=12,
                 axis_title_size = 12) +
  theme(legend.position="none",
        plot.title = element_textbox_simple(),
        plot.subtitle = element_textbox_simple(),
        plot.caption.position = "plot",
        aspect.ratio=1.25,
        plot.background = element_rect(color = "black", size = 2))